Step 7: Assess Climate Change Risk
The areas where the projected daily maximum temperature range sits in relation to the 34 °C threshold for three RCPs and two time periods are shown in Figure A3.
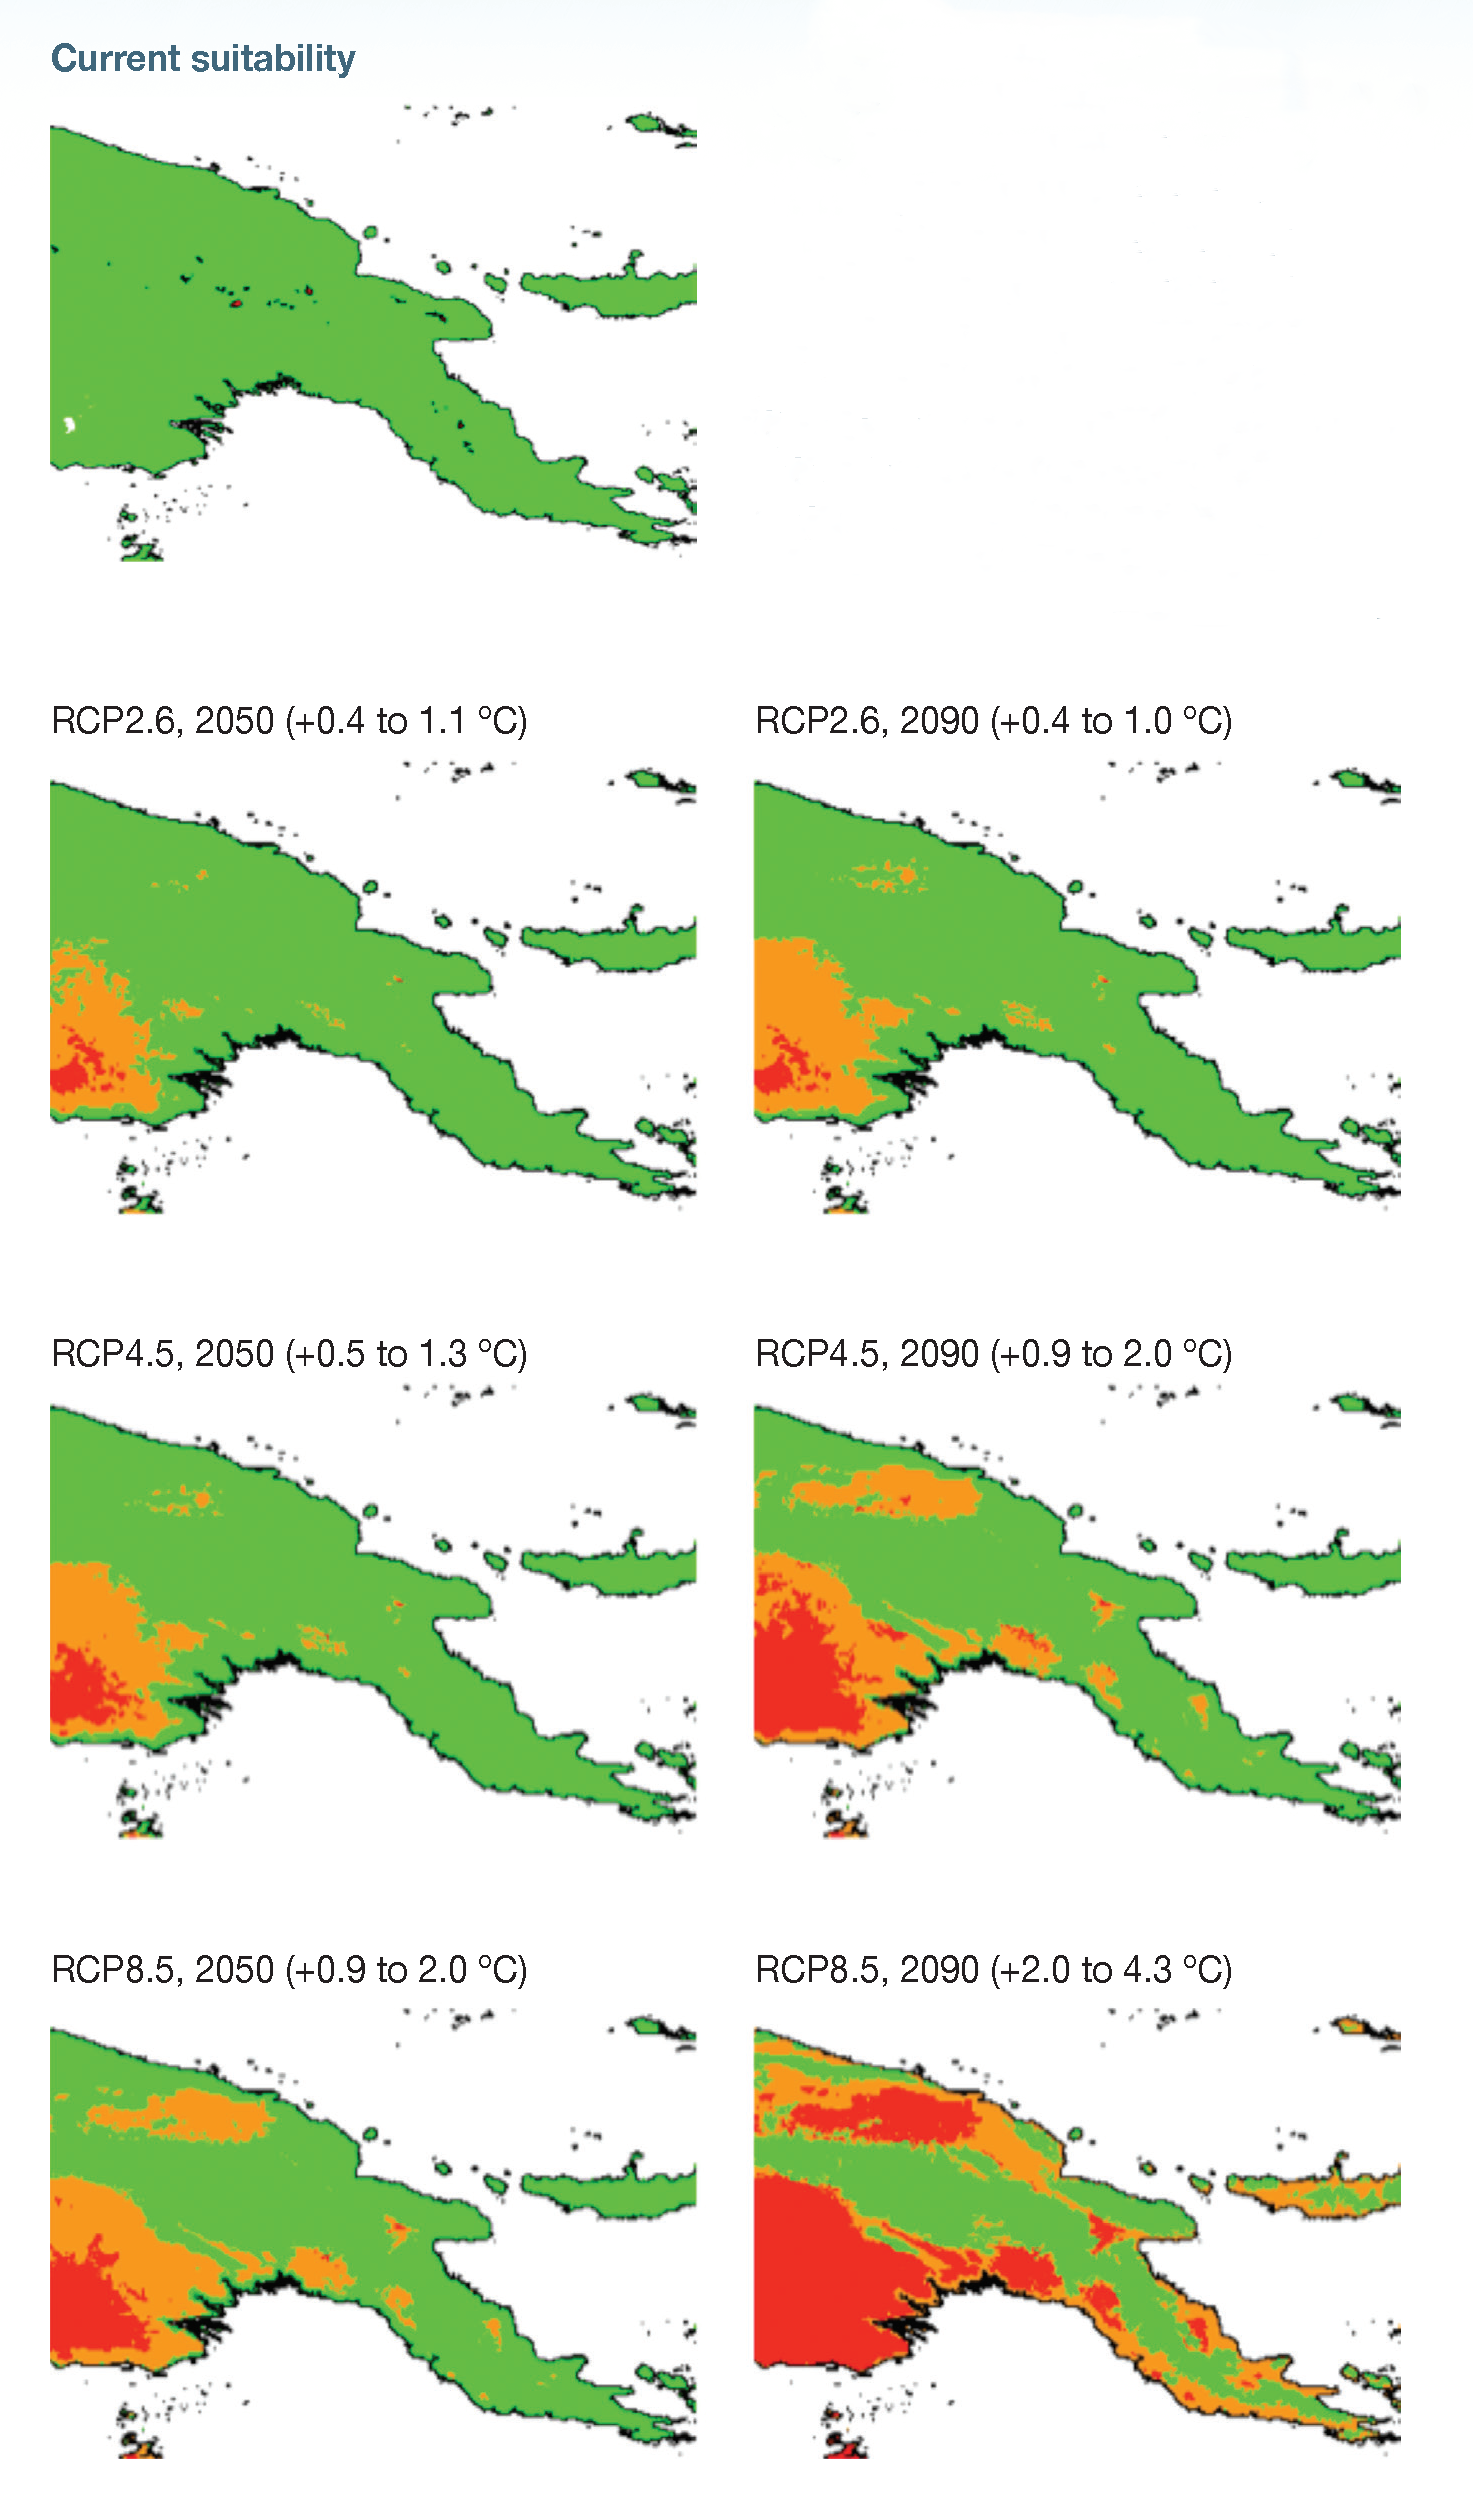
Looking at this plot in terms of vulnerability and risk, we can interpret the areas in green (temperature range below the threshold) as being fairly low risk of being limited by temperature, areas in orange as potentially at risk, and red areas as being very high risk of being unsuitable. The warmest month in the region of the southern lowlands is already close to 34 °C, so is projected to have increased risk of temperature impacts under all scenarios and time periods. Other than that region, the results suggest the effect of the emissions scenario is very important – under a very low scenario (RCP2.6), the increase in risk is seen southern lowlands, but is minimal even by 2090 over most of PNG. Under RCP4.5 some regions of the northern lowlands could be affected. Under RCP8.5, the temperature of the warmest month could be an important limiting factor to sweet potato growing in most of the lowlands by 2090.
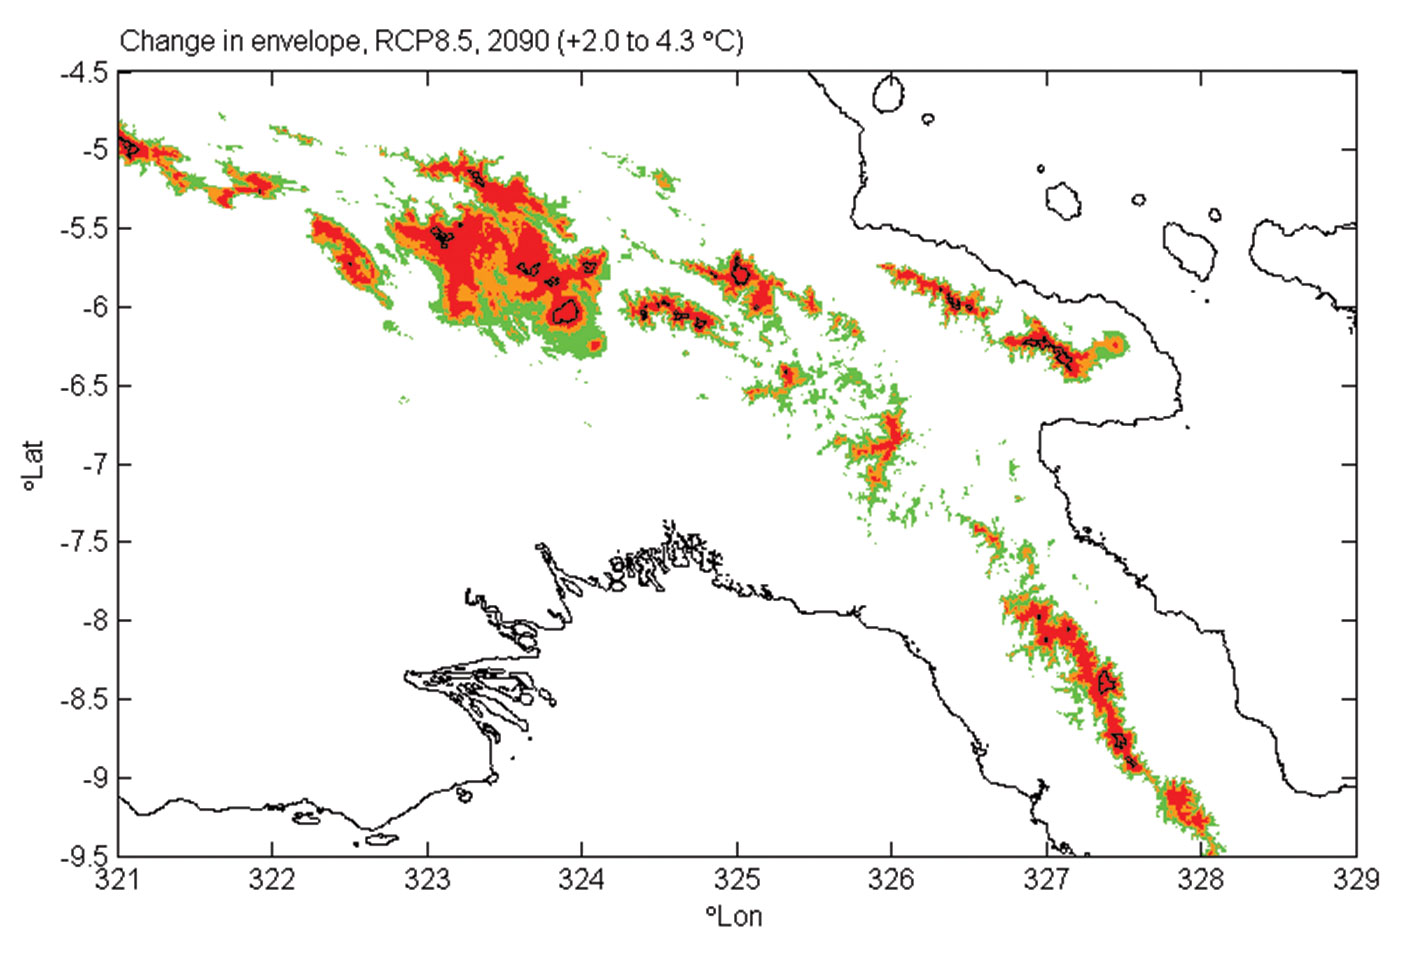
Looking at daily minimum temperature of the coolest month of the growing season, we see that even under RCP8.5 by 2090 (Fig. A4), relatively small new areas are projected to become less limited by cool nights <10 °C. This is expected due to the steep climatic gradients on the slopes of the highlands.
In a full risk assessment, this temperature analysis would then need to be combined with other analyses (e.g. rainfall, droughts, pests, disease, extreme events) to assess the overall risks and vulnerability of the industry.