Step 6: Construct Climate Change Projections
For daily maximum temperature, we look at the warmest month in the growing season. For daily minimum temperature, we look at the coolest month in the same season. The climate surfaces of these variables in the present climate are shown in Figures A1 and A2.
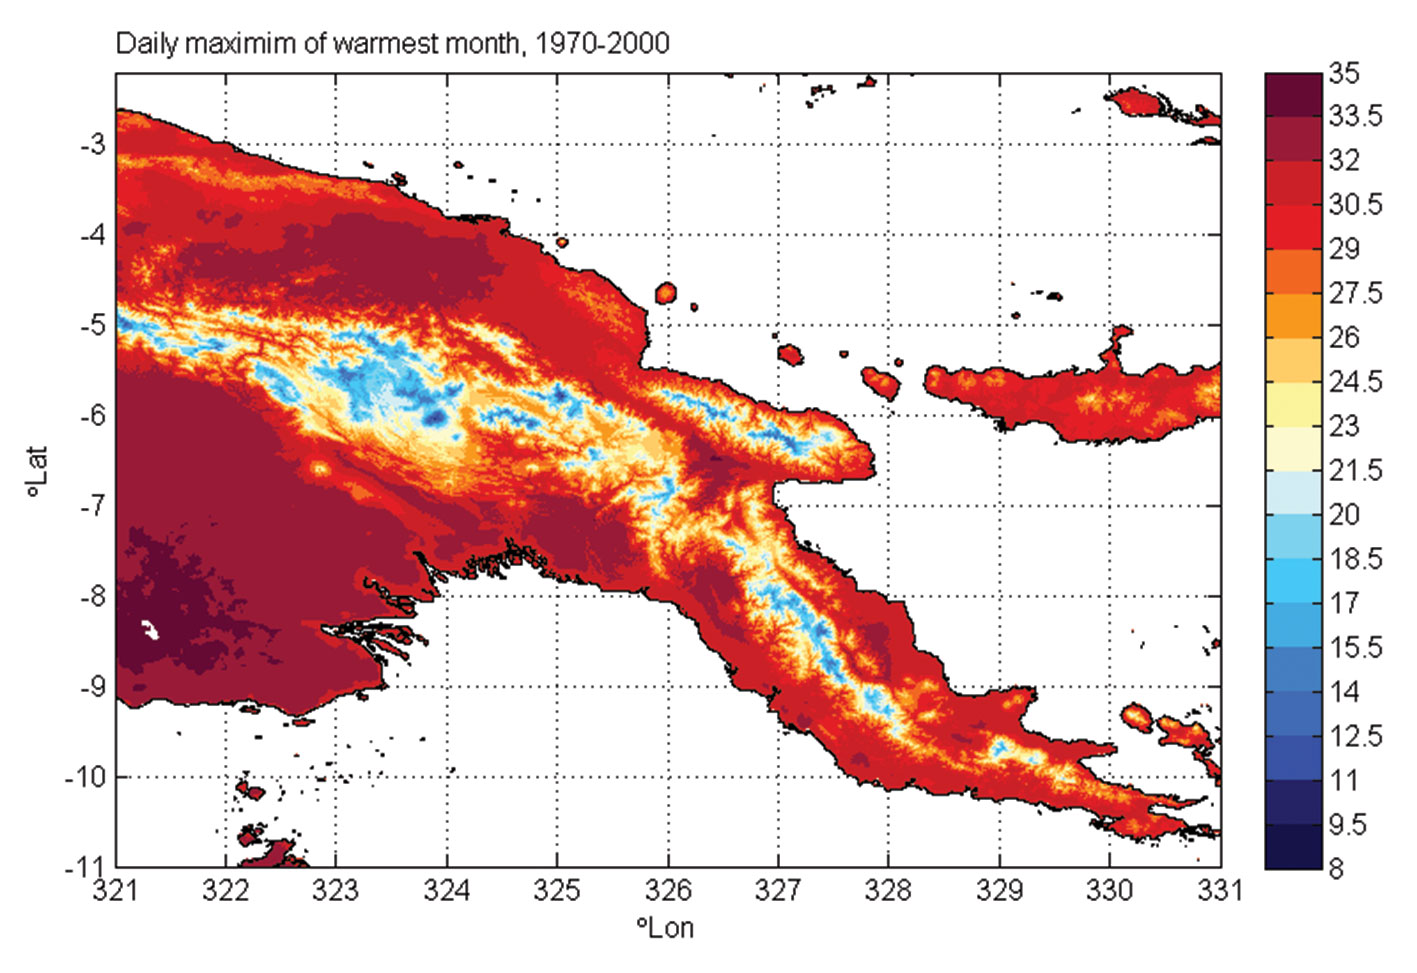
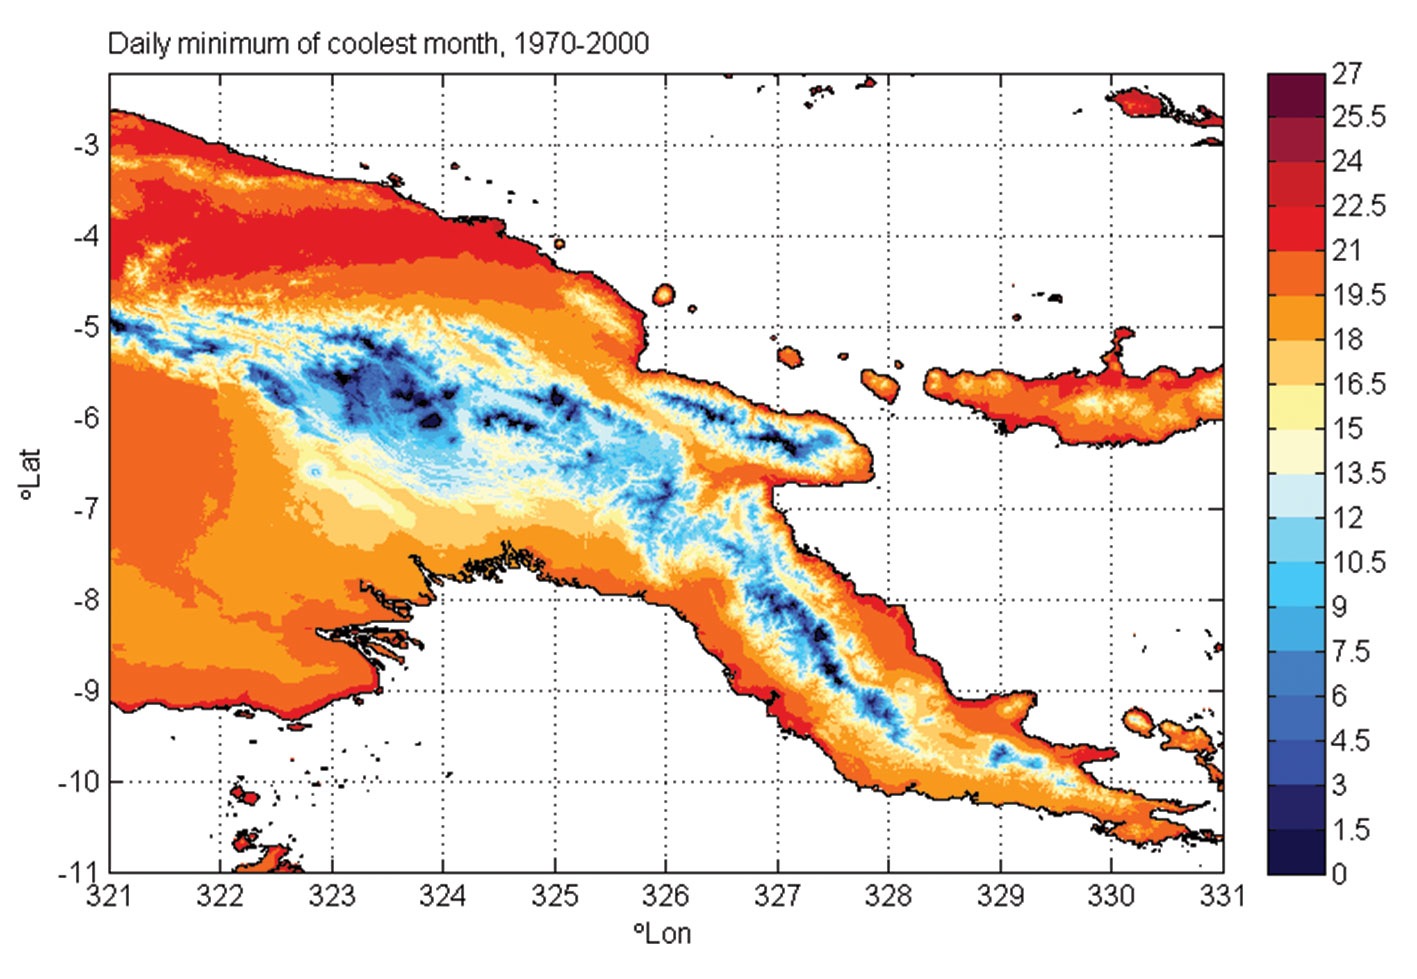
We assume that if the average temperature for a month in the growing season is above or below a threshold, then this will limit the growth of the crop in a typical year (an examination of daily data could be done as a follow-up study).
We can apply the projected change to the observed dataset using a simple scaling approach – adjusting the observed climate surface up or down using the change factor from projections. The absolute change in temperatures (°C) is applied using an addition. Two change factors are applied for each time period and each RCP: the lower end of the model range and the upper end. For example, if the mean daily maximum temperature in a cell is 31.5 °C the range of projected change is 1.5 to 2.8 °C, then the future value of that cell is 33 to 34.3 °C. Following this, the values that are over the threshold are found, in this case 34 °C for daily maximum temperature. The cell is categorised as:
- The range of future temperature is below the threshold
- The range of future temperature crosses the threshold (high value is over, low is under)
- The range of future temperature is all above the threshold
For our example above, the cell would be in category 2 (the low end of the range, 33 °C, is below the threshold of 34 °C, and the high end, 34.3 °C is above it).
Note: The baselines are slightly different: 1970–2000 for WorldClim, 1986–2005 for the projections. We can’t adjust the observed data or the projections, so we will just need to use these results as they are and communicate this point in the results.