Step 4: Collect Observed Climate Data
Climate projections tell us about how the climate may change under future emissions scenarios, but this needs to be put in context of what the climate is like now and in the past. For this, we need historical observed climate data. When projections are applied to observed data, ‘application-ready’ projections data can be generated. This is very helpful to inform sectoral climate risk assessments, climate sensitivity screening and related ‘climate-smart’ decisions for more effective and efficient adaptation and disaster risk management planning.
Key activities
- Determine what type of observed data is needed
- Find an appropriate dataset
- Access the dataset
- Process the dataset
- Determine the quality and uncertainty of the data behind the dataset
Determine what type of observed data is needed
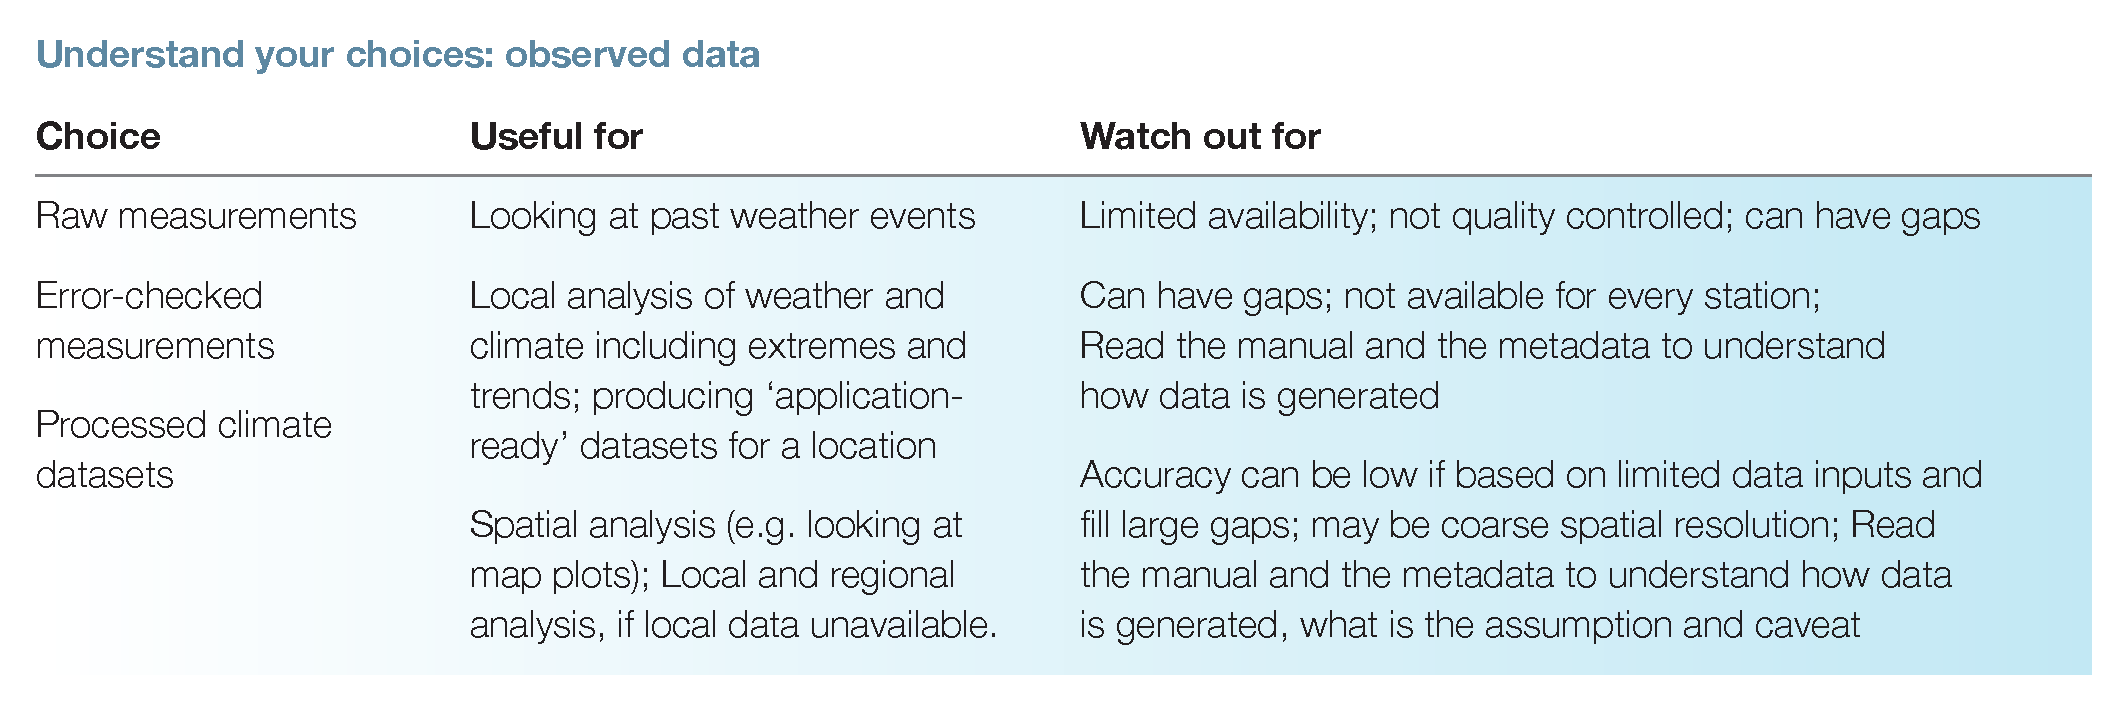
There are three main categories of observed data:
- Raw measurements from places such as weather stations managed by NMHSs
- Quality-controlled (error-checked) measurements such as those available at the Pacific Climate Change Data portal. These are generally more useful for climate studies than raw measurements.
- Processed climate datasets which use the observations, plus other input such as satellite data or modelling to produce gridded climate datasets (also called reanalysis datasets).
These datasets can be very useful, but it is important to understand what each one offers. For example:
- Spatial coverage – some are global; some just cover the tropics or a particular region.
- Spatial resolution – some are for point locations; others are on a grid. For gridded data, ensure that you understand the size of the grid cells, and how the dataset fills the gaps between measurements to create the grid.
- Time frame – some go a long way back in time, while others only contain more recent data.
- Time step – different datasets may contain data at different time steps, such as annual, seasonal, monthly, daily or sub-daily.
- Variables – these differ between datasets.
Find an appropriate dataset
Raw station datasets usually can be found through the relevant NMHS, but access requires formal approval by the NMHS Director or delegate.
For processed climate datasets, the National Centre of Atmospheric Research (NCAR) in the United States has compiled a useful guide. Some of the major processed datasets include:
- The Hadley Centre Sea Ice Sea Surface Temperature dataset (HadISST)
- Various gridded air temperature datasets to look at long-term temperature change (GISTEMP, HadCRUT4, MLOST, Berkeley)
- Tropical Rainfall Measuring Mission (TRMM) of high-resolution rainfall data.
High-resolution climate surfaces of the average climate in recent years (e.g. WorldClim) are also useful for looking at questions that require highly localised climate information (such as the difference between one side of an island to the other, or temperature over mountain ranges), but it is important to understand the features and limitations of producing these fine-scale surfaces using statistical techniques.
Access the dataset
Once all the available datasets have been reviewed, the features of each one have been understood and there is a clear plan, then the data can be accessed. This is not always simply a matter of downloading all the data to a desktop computer. Issues to manage include:
- Size: Datasets can be very large, so either need a lot of disk space to download, or just the part of the dataset that is needed can be accessed or downloaded (e.g. just the area, time period or time step that is needed). Datasets can be kept on large central computers rather than desktop computers.
- Updates: Datasets are often updated with new data and there are also different versions of datasets released – a plan for updating your dataset with the latest data and latest version is needed.
IMPORTANT: Some datasets are very large, so may need a lot of internet bandwidth for downloading and/or computer disk space for storage.
Process the dataset
Once access has been established, the dataset needs to be checked and set up ready to use. Checks include the area or location, coverage, time period, variables, time steps and the presence of gaps or errors.
Data come in various computer formats, each requiring certain software and skills. Time series from a particular site (e.g. from the Pacific Climate Data for the Environment/CliDE data management system operated by NMHSs) can be downloaded and plotted in software such as Excel, but others such as gridded datasets, need specialised software and skills. Specialised skills are also required to examine and analyse the data.
It is good practice to have quality control checks on the analysis at all steps, thereby ensuring that the data is suitable for what is necessary, doesn’t have errors in it and is updated regularly. This may require assistance from experienced data managers. Assistance to analyse the data, and to check the analysis, may also be needed.
IMPORTANT: Some datasets are specialised, so need high-level computer skills to use them.
Determine the quality and uncertainty of the data behind the dataset
As well as quality controlling data, it is important to understand how the datasets were generated and what this means for how they are used. Considerations include:
- The inputs – what data went into it and the quality of those data (e.g. a gridded temperature surface may only use a few station records for a whole island)
- How gaps are filled – gaps in time or space can be filled using various statistical methods. These methods may involve the use of simultaneous values at nearby stations to calculate an estimated value for that missing data time. For some variables, gaps in the data might be filled based on other variables, for instance, humidity can be calculated from the minimum temperature and solar radiation can be calculated from extraterrestrial radiation which is a function of geographic location and the Julian day (see examples here). The users need to be aware of the pros and cons of the method being used and understand all related caveats.
Datasets with few inputs, poor quality inputs or large gaps to fill should be treated as having lower confidence, and this should be noted.
IMPORTANT: Use the simplest dataset available that covers the required range of relevant climate variables.