Thailand map markerConstructing Climate Projections


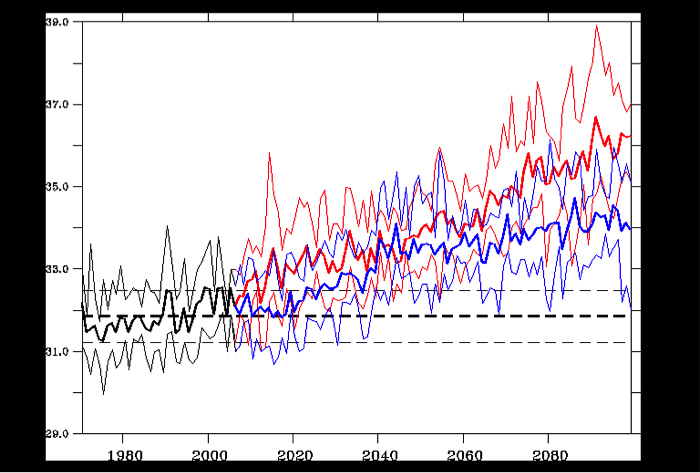
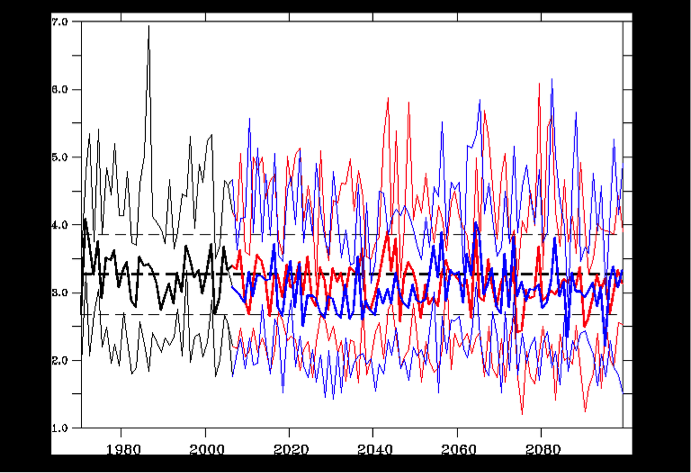
In this case study, the time series of the temperature and rainfall fields were extracted from CCAM outputs forced by six global climate models for both RCPs (RCP4.5 and RCP8.5). The median, minimum and maximum values of the annual maximum temperature (Tmax) and rainfall of the six downscaled model data were calculated and plotted. These plots indicate an increase in temperature over time and a less clear change in rainfall.

Simulated annual mean Tmax (°C) for a station in Thailand for the historical period (1970–2005, black) and to 2099 using two RCPs (RCP4.5, blue and RCP8.5, red). The thick lines are the six-model mean, while the thin lines are the maximum and minimum annual values among the six simulations.
Simulated annual mean rainfall (mm/day) for a station in Thailand for the historical period (1970–2005, black) and to 2099 using two RCPs (RCP4.5, blue and RCP8.5, red). The thick lines are the six-model mean, while the thin lines are the maximum and minimum annual values among the six simulations.