Defining Project Requirements
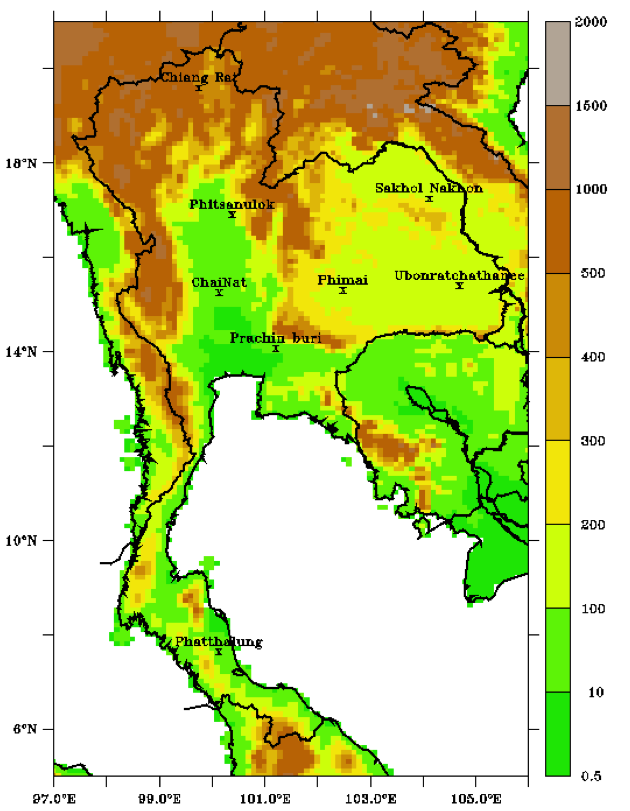
The Thailand case study examined the possible effects of climate change scenarios on rice production in eight sites (map below). These sites are in a variety of sub-regions with different climates and topography, from mountains to low coastal areas.
The assessment used the CSM-CERES-Rice simulation model under the Decision Support System for Agrotechnology Transfer (DSSAT) version 4.6.1.0. This rice model needed data for four climate variables: temperature (daily maximum and daily minimum air temperature), rainfall (daily), and solar radiation (daily mean).
RCM data was available for the area at around 10 km resolution for five GCMs (CCSM4, CNRM-CM5, GFDL-CM3, MPI-ESM-LR, and NorESM1-M).
As the values were only needed for the eight locations, gridded data was not necessary; data for the nearest climate model grid point to the location was extracted from the climate model outputs.
1971–2005 was chosen as the historical period and 2006–2040 for the future. These selections were the result of discussions with stakeholders, resource availability and its relevance to rain-fed rice agricultural planning.