 Analyzing Projections
These figures from the case study show analyses of model simulated maximum temperature and rainfall for the period 1971–2100. The six-model means, as well as the maximum and minimum values from the individual models, are given.
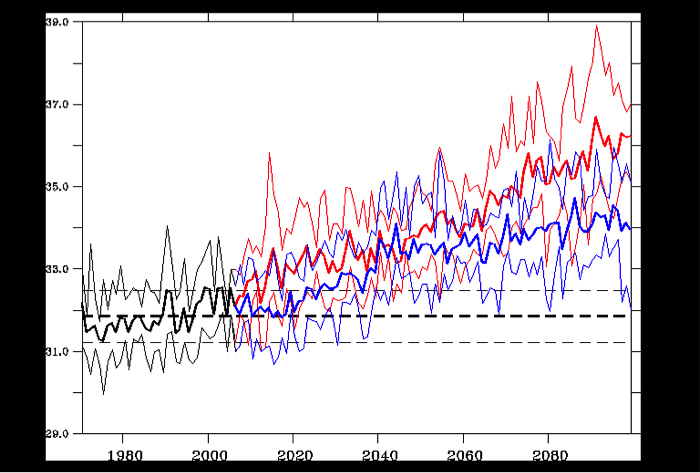
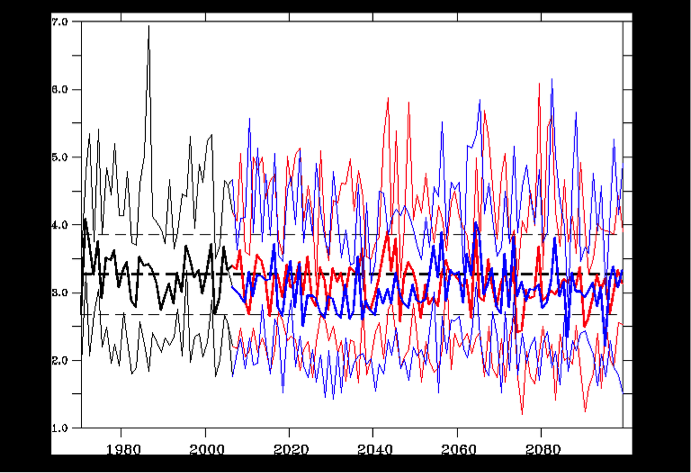
From this analysis, it is evident that the projected temperature increase is outside the normal variability for even the lower emission scenario (RCP4.5) (top plot). However, while the median change in rainfall (bottom plot) shows slight decreases, the projections show possible increases and decreases and the changes are within historical variability.
The preliminary assessment could be that the projected changes in temperature are significant while the projected changes in rainfall are not significant. A more statistically rigorous assessment of the significance was not conducted due to resource constraints.