 Selecting Model Simulations
Following the principle of the Climate Futures tool, this case study plotted the projected changes in annual temperature against those of annual rainfall for data from all the initial models sourced.
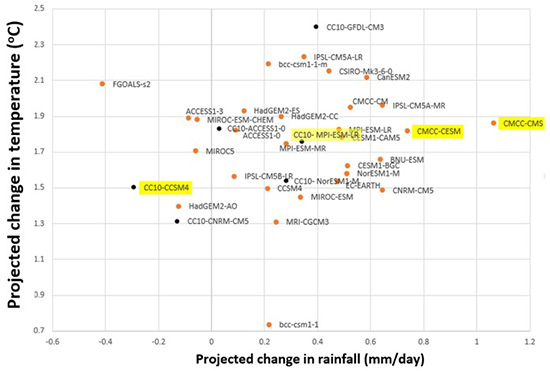
Based on this plot, and other considerations such as data availability for the selected RCPs, the chosen models were:
- CC10-CCSM (the RCM showing the largest drying at this location)
- CC10-MPI-ESM-LR (in the middle of the projections, so representative of the consensus)
- CMCC-CESM
- CMCC-CM5.
The CMCC-CM5 results indicated the greatest increase in rainfall but did not have simulations for RCP4.5. For this reason, the simulations from CMCC-ESM were also selected.