 Analyzing Projections
Two projections analyses were conducted in this case study. The first compares the future rainfall normal distribution against the current, while the second estimates projected changes in the climatological mean.
Rainfall normal distribution
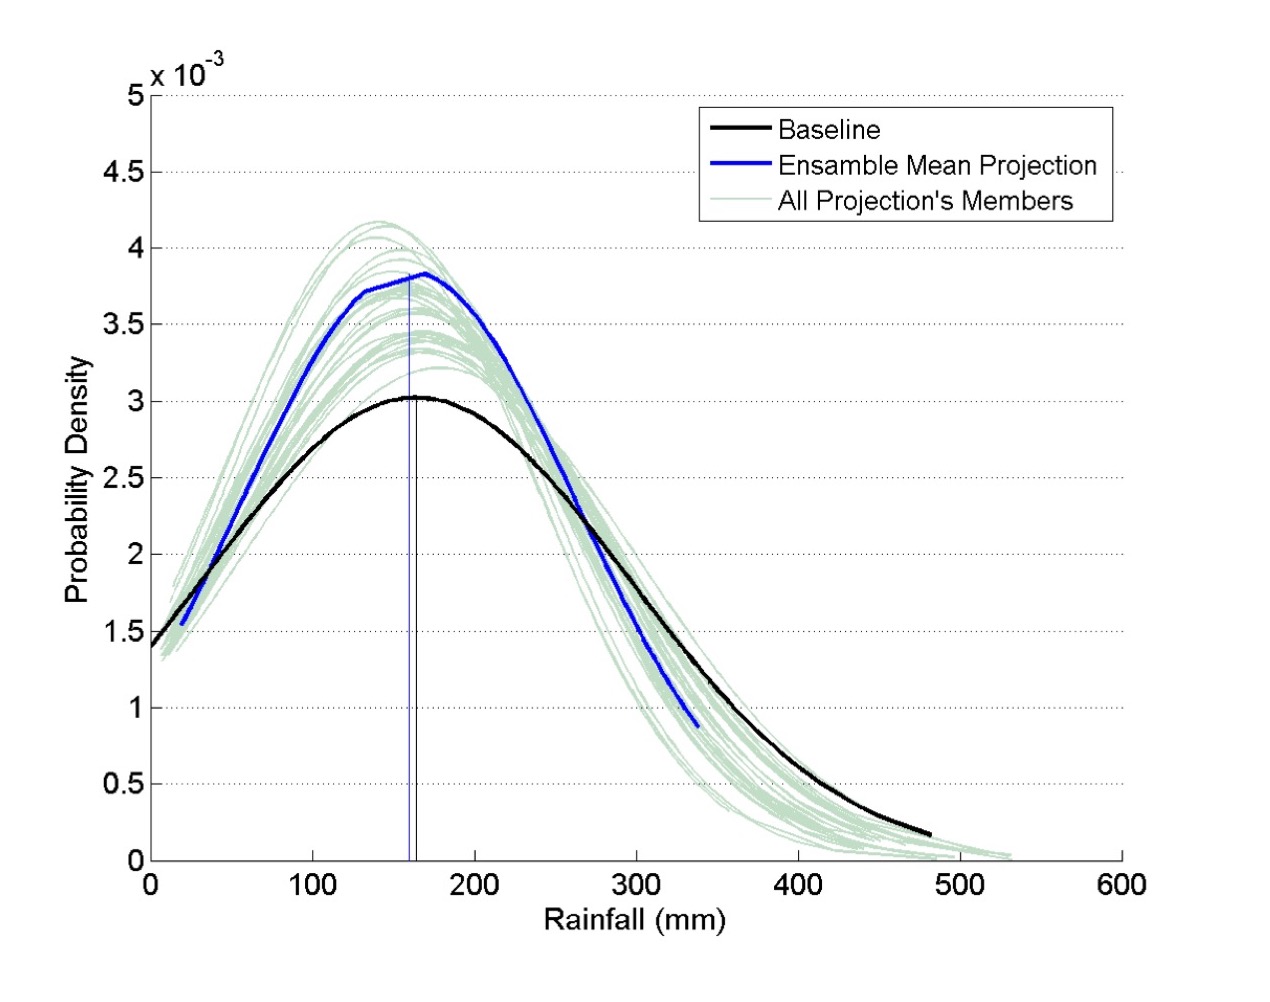
The statistical downscaling output shows that projected mean is very similar to those of the baseline. However, there is an increased probability of rainfall near the baseline mean and a reduced probability of rainfall amounts greater than about 300 mm. Furthermore, standard deviation in the projections is lower than in the baseline, suggesting less variability in rainfall in the future.
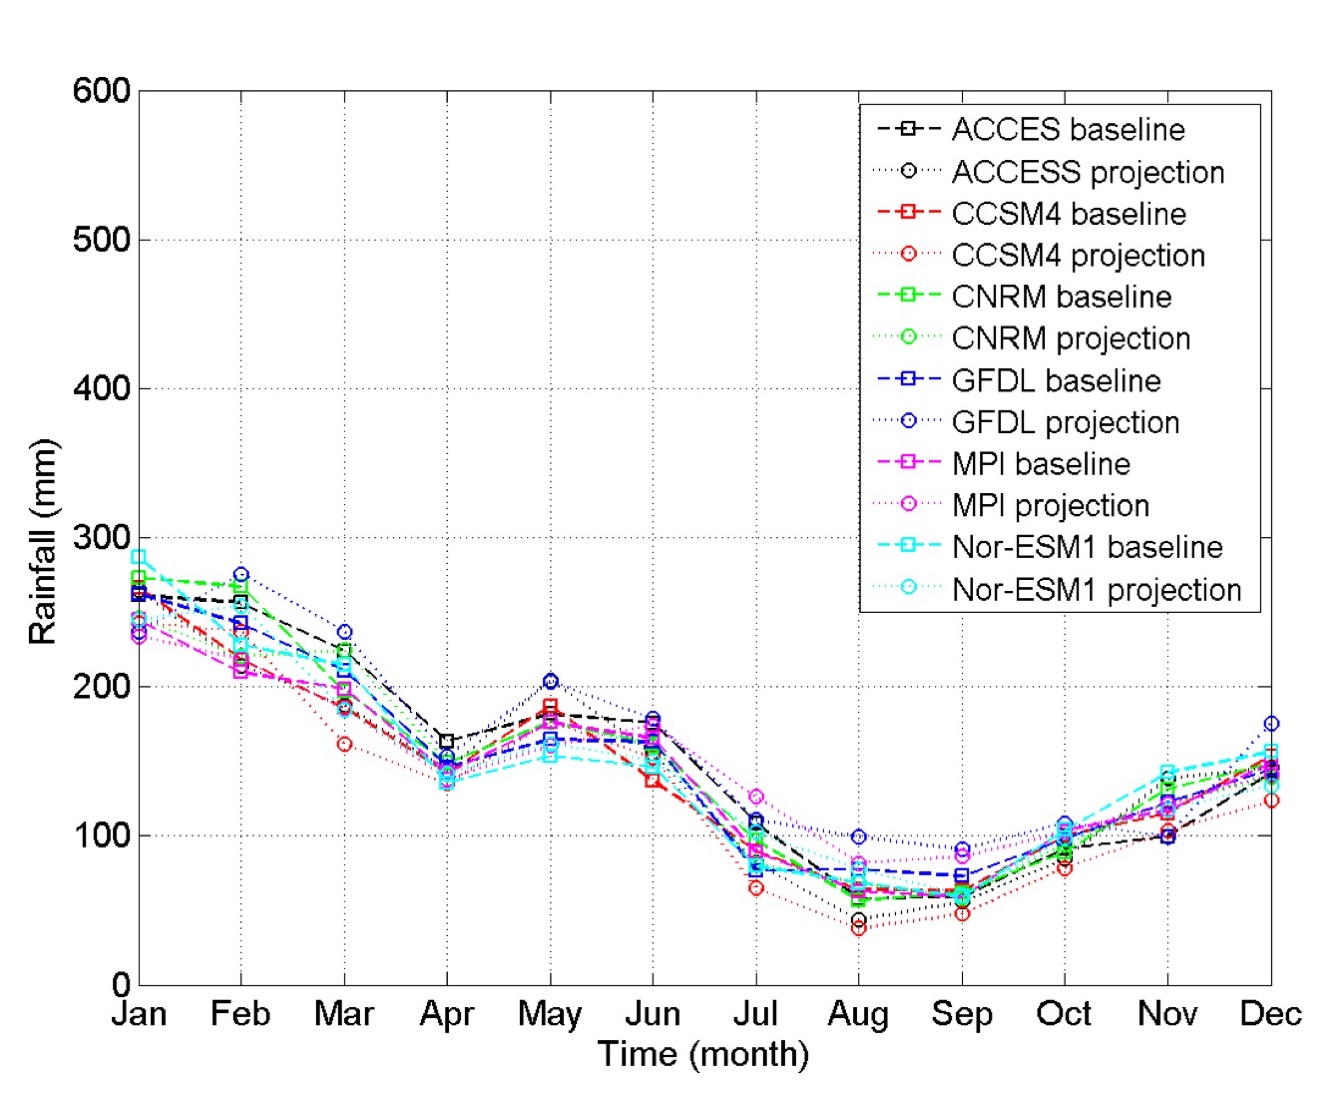
The normal distributions from the dynamical downscaling outputs vary (plots not shown here). Some models (ACCESS1.0, CCSM4, and CNRM-CM5) show that the projected mean is lower than the baseline; one model (GFDL-CM3) shows that projected mean is higher than that of the baseline; and two models (MPI-ESM-LR and NorESM1-M) show that the projected mean is similar to the baseline. All models show that projected standard deviation is similar to the baseline.
Changes in climatological mean
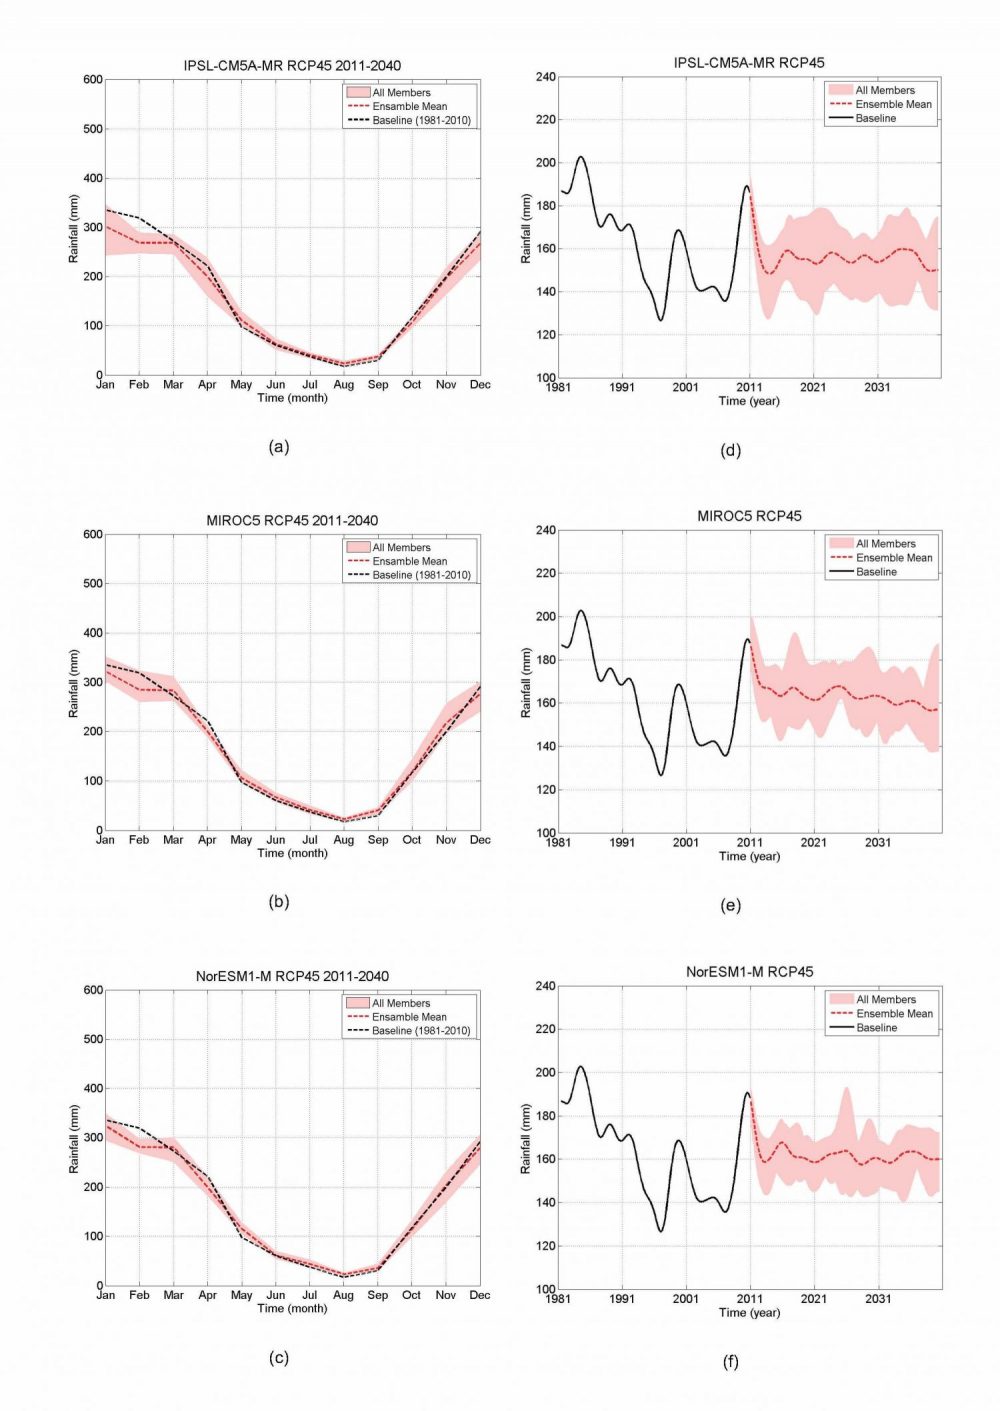
The projected seasonal pattern (2011–2040) is similar with that of the baseline (1981–2040). However, the projected rainfall in January and February is lower than in the baseline. The spread of the all-model ensemble is relatively small, suggesting small uncertainty in rainfall projections. The dynamical model outputs also suggest similar results.
Confidence and uncertainty in projections
Confidence in projections developed using the statistical downscaling approach is improved by the large number of GCM-based datasets used. Moreover, the use of observational data for representing the historical period gives a more realistic starting point. However, there is very little interannual variability and variation over time in the projections, which seems to be less realistic, and reduces confidence in the projections.
The dynamical downscaling results indicate biases for the current climate. Although the simulations capture the observed annual cycle, they show smaller amplitude: the downscaling results showed less simulated rain in the wet season and too much simulated rain in the dry season in comparison to the observation. In addition, the spatial pattern of the modelled rainfall is rather poor. Contrary to the explicit trend of temperature increase, simulation and projection of rainfall did not show perceivable pattern since model resolution was too coarse and thus could not represent the local rainfall distribution well.
Additional work is necessary to explain the little variability in the statistically downscaled results and to gain greater understanding of the range of possible futures and to place the downscaled results in context.