Communicating Information
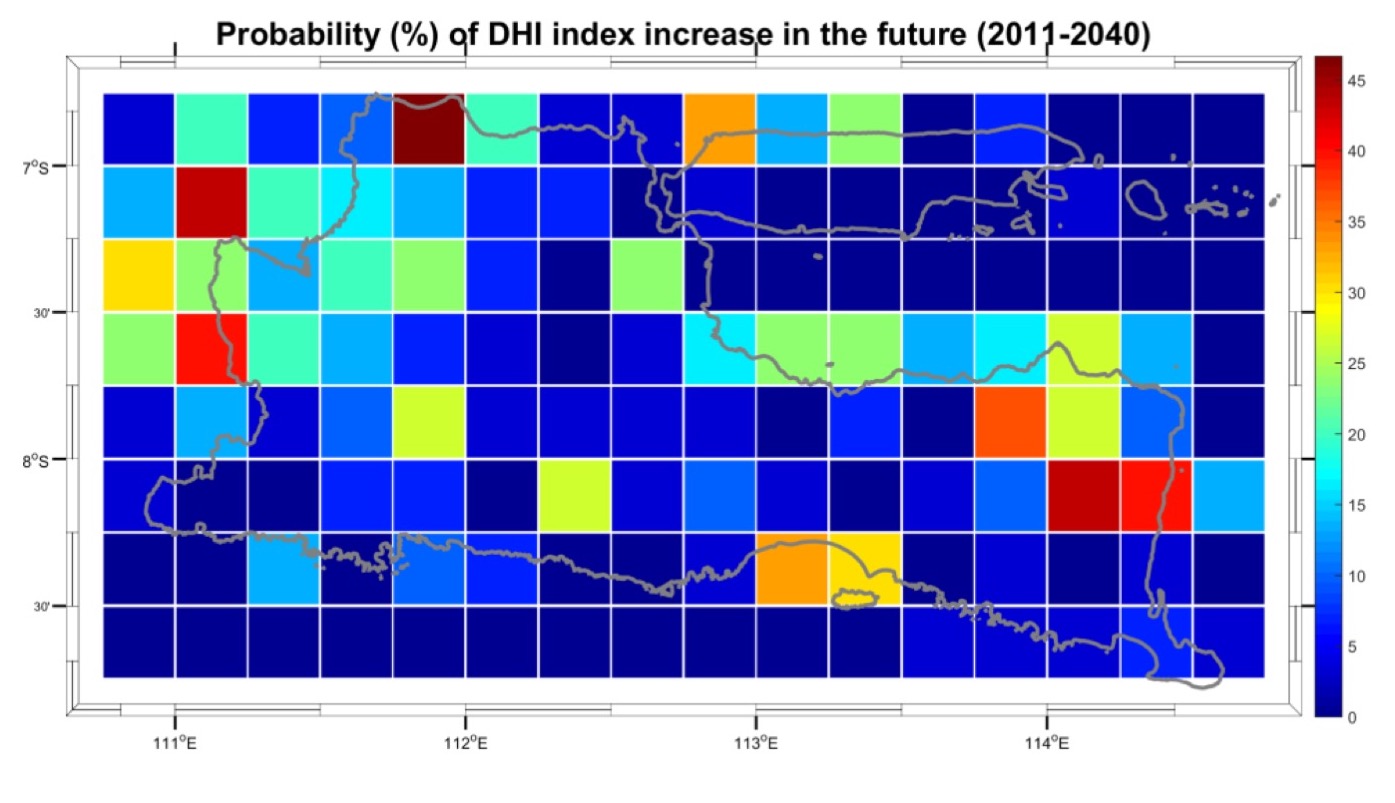
Projections for drought hazard in East Java Province were developed using a Drought Hazard Index. The projections were based on statistically downscaled rainfall simulations from three global climate models (GCMs) and dynamically downscaled rainfall simulations from six GCMs.
The projections were presented in a series of drought hazard index maps, where the likelihood of drought is presented as a probability of occurrence (as a percentage). The map below shows the results from the statistical downscaling model simulations and indicates that drought may increase in the future but the likelihood varies spatially.