Evaluating Climate Model Data
Dynamically downscaled model data was evaluated against baseline climate data developed from the merged TRMM-APHRODITE dataset and six downscaled GCMs obtained from CSIRO. The baseline climate data is the basis for the current climate in the statistical downscaling approach, so analysis of it is not needed for the baseline period.
The evaluation was conducted through two approaches.
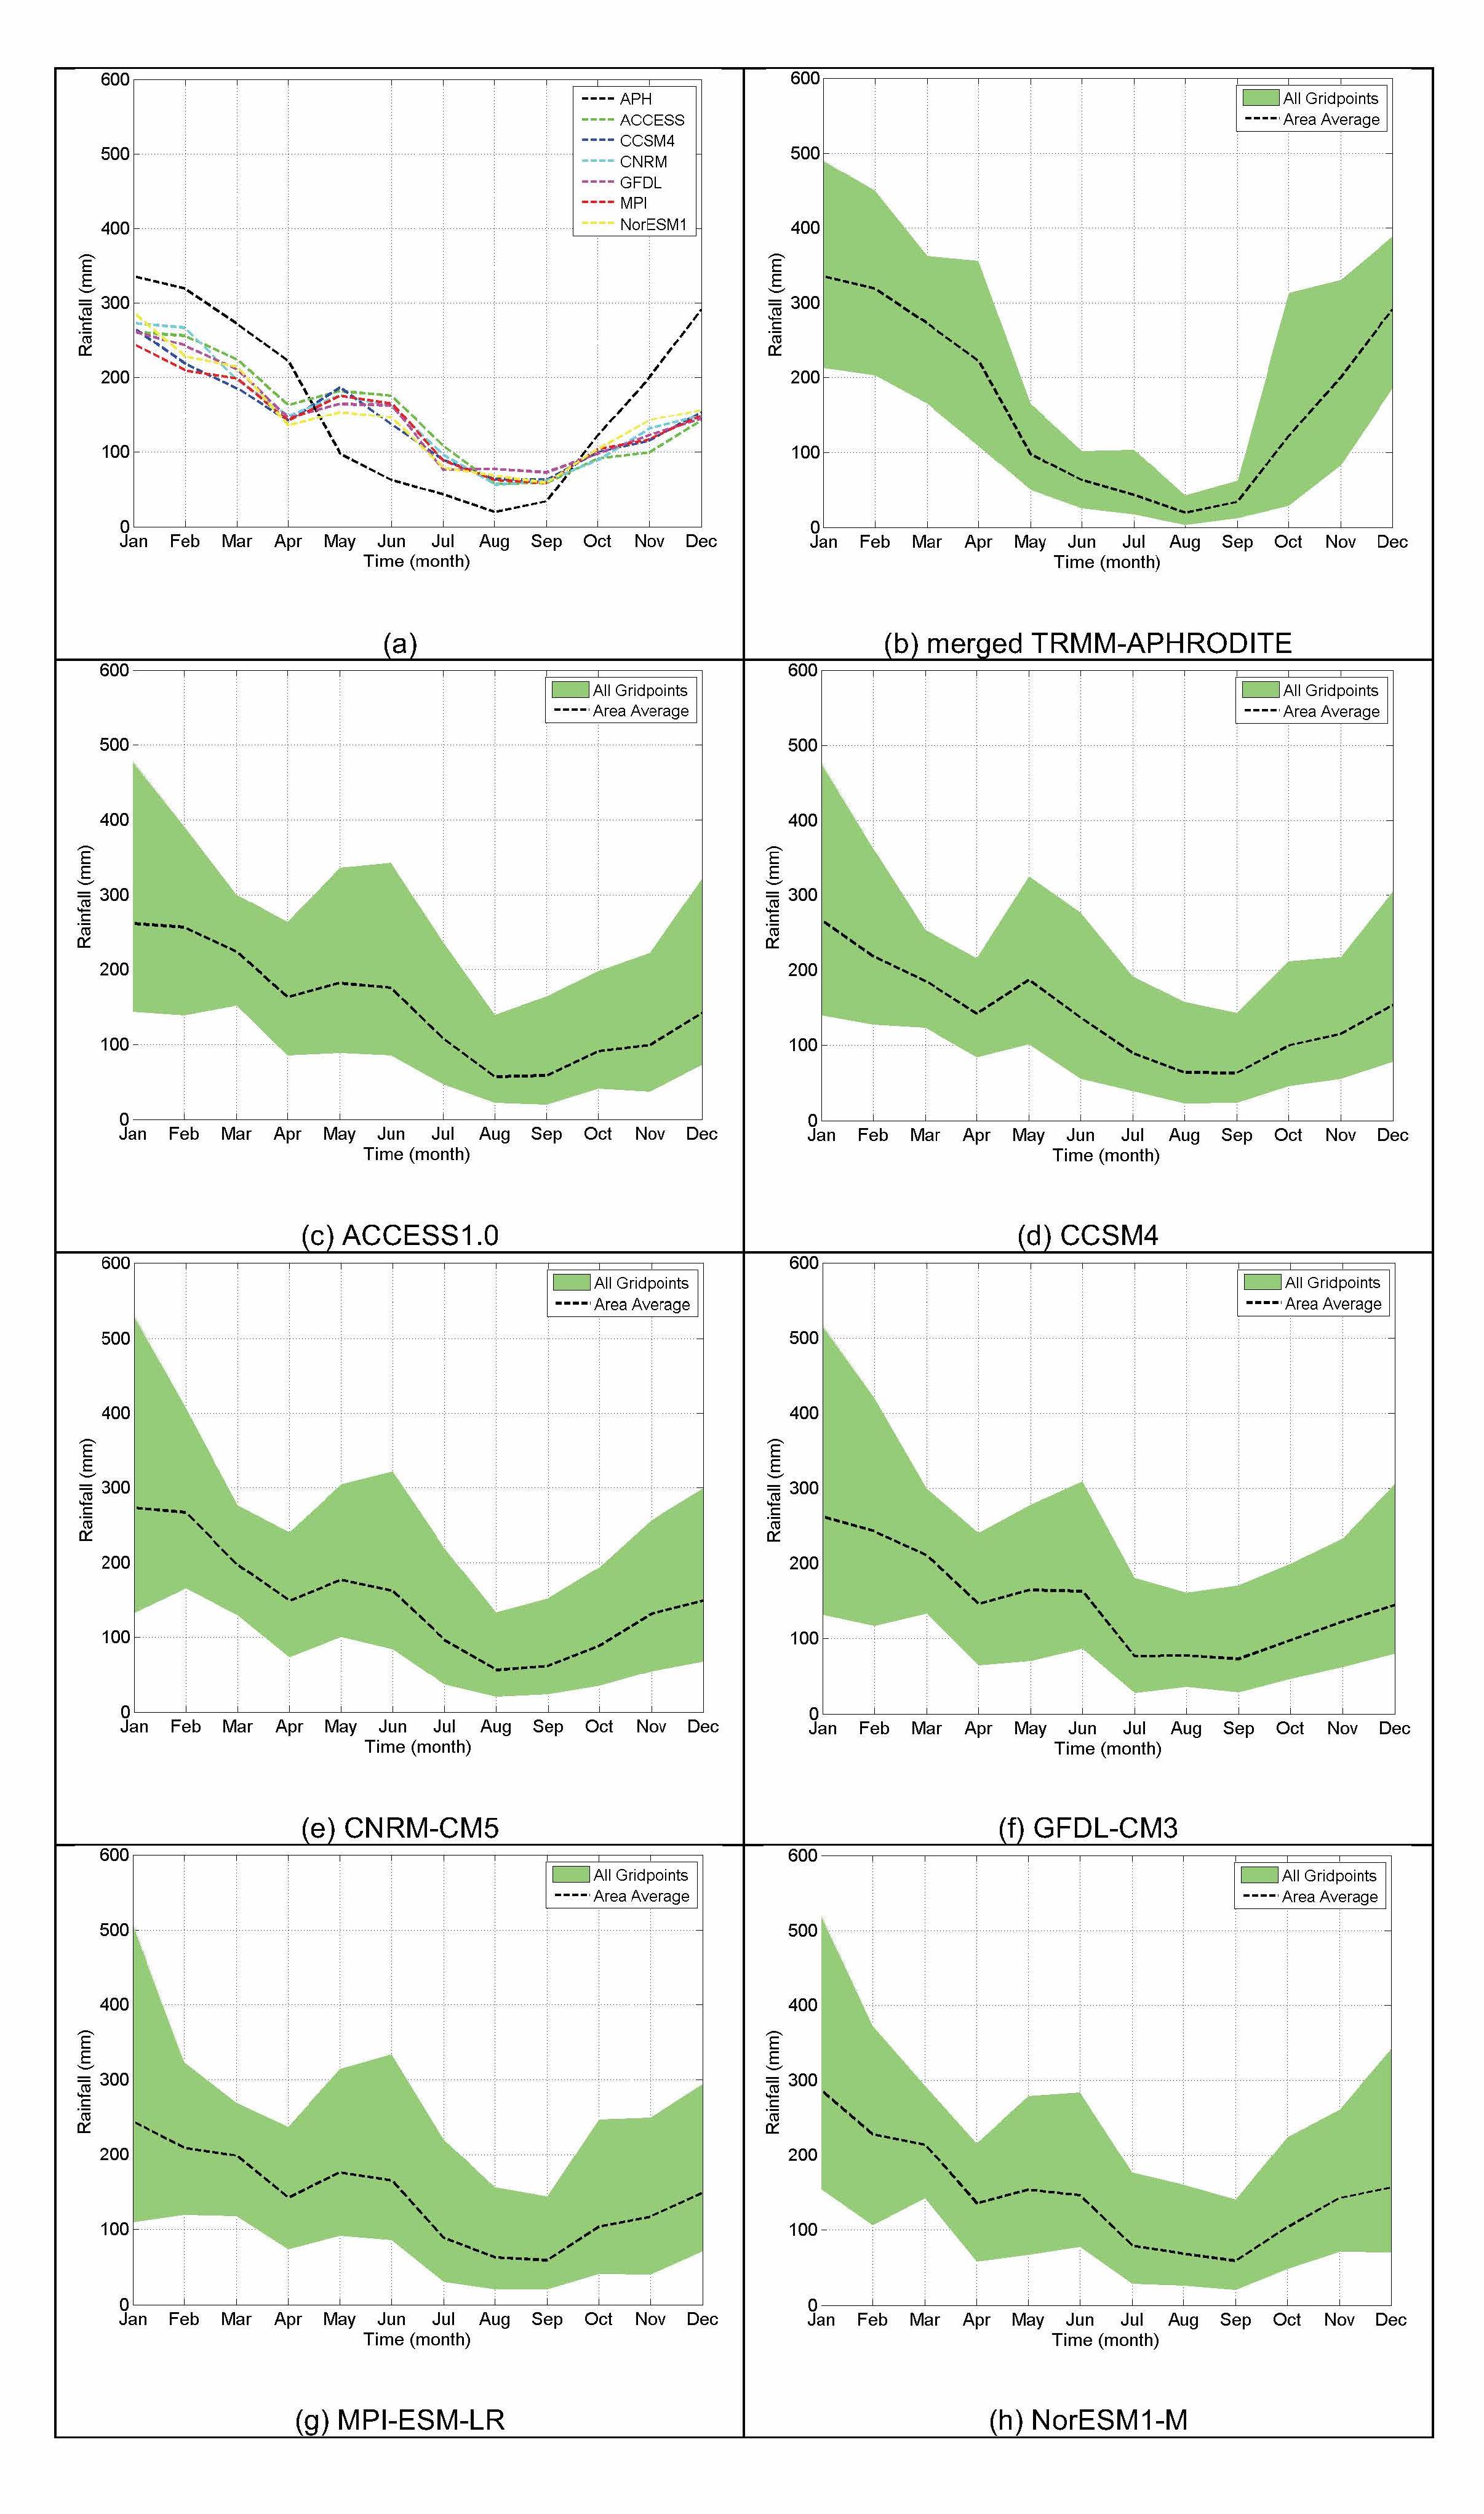
The first approach compared the climate model long-term mean monthly rainfall averaged over the East Java Province region against the baseline climate data (top figure).
The rainfall pattern over East Java is influenced by the monsoon. The dynamically downscaled results capture the annual cycle; however, the amplitude is somewhat reduced due to too much rain in the dry season and too little rain in the wet season.
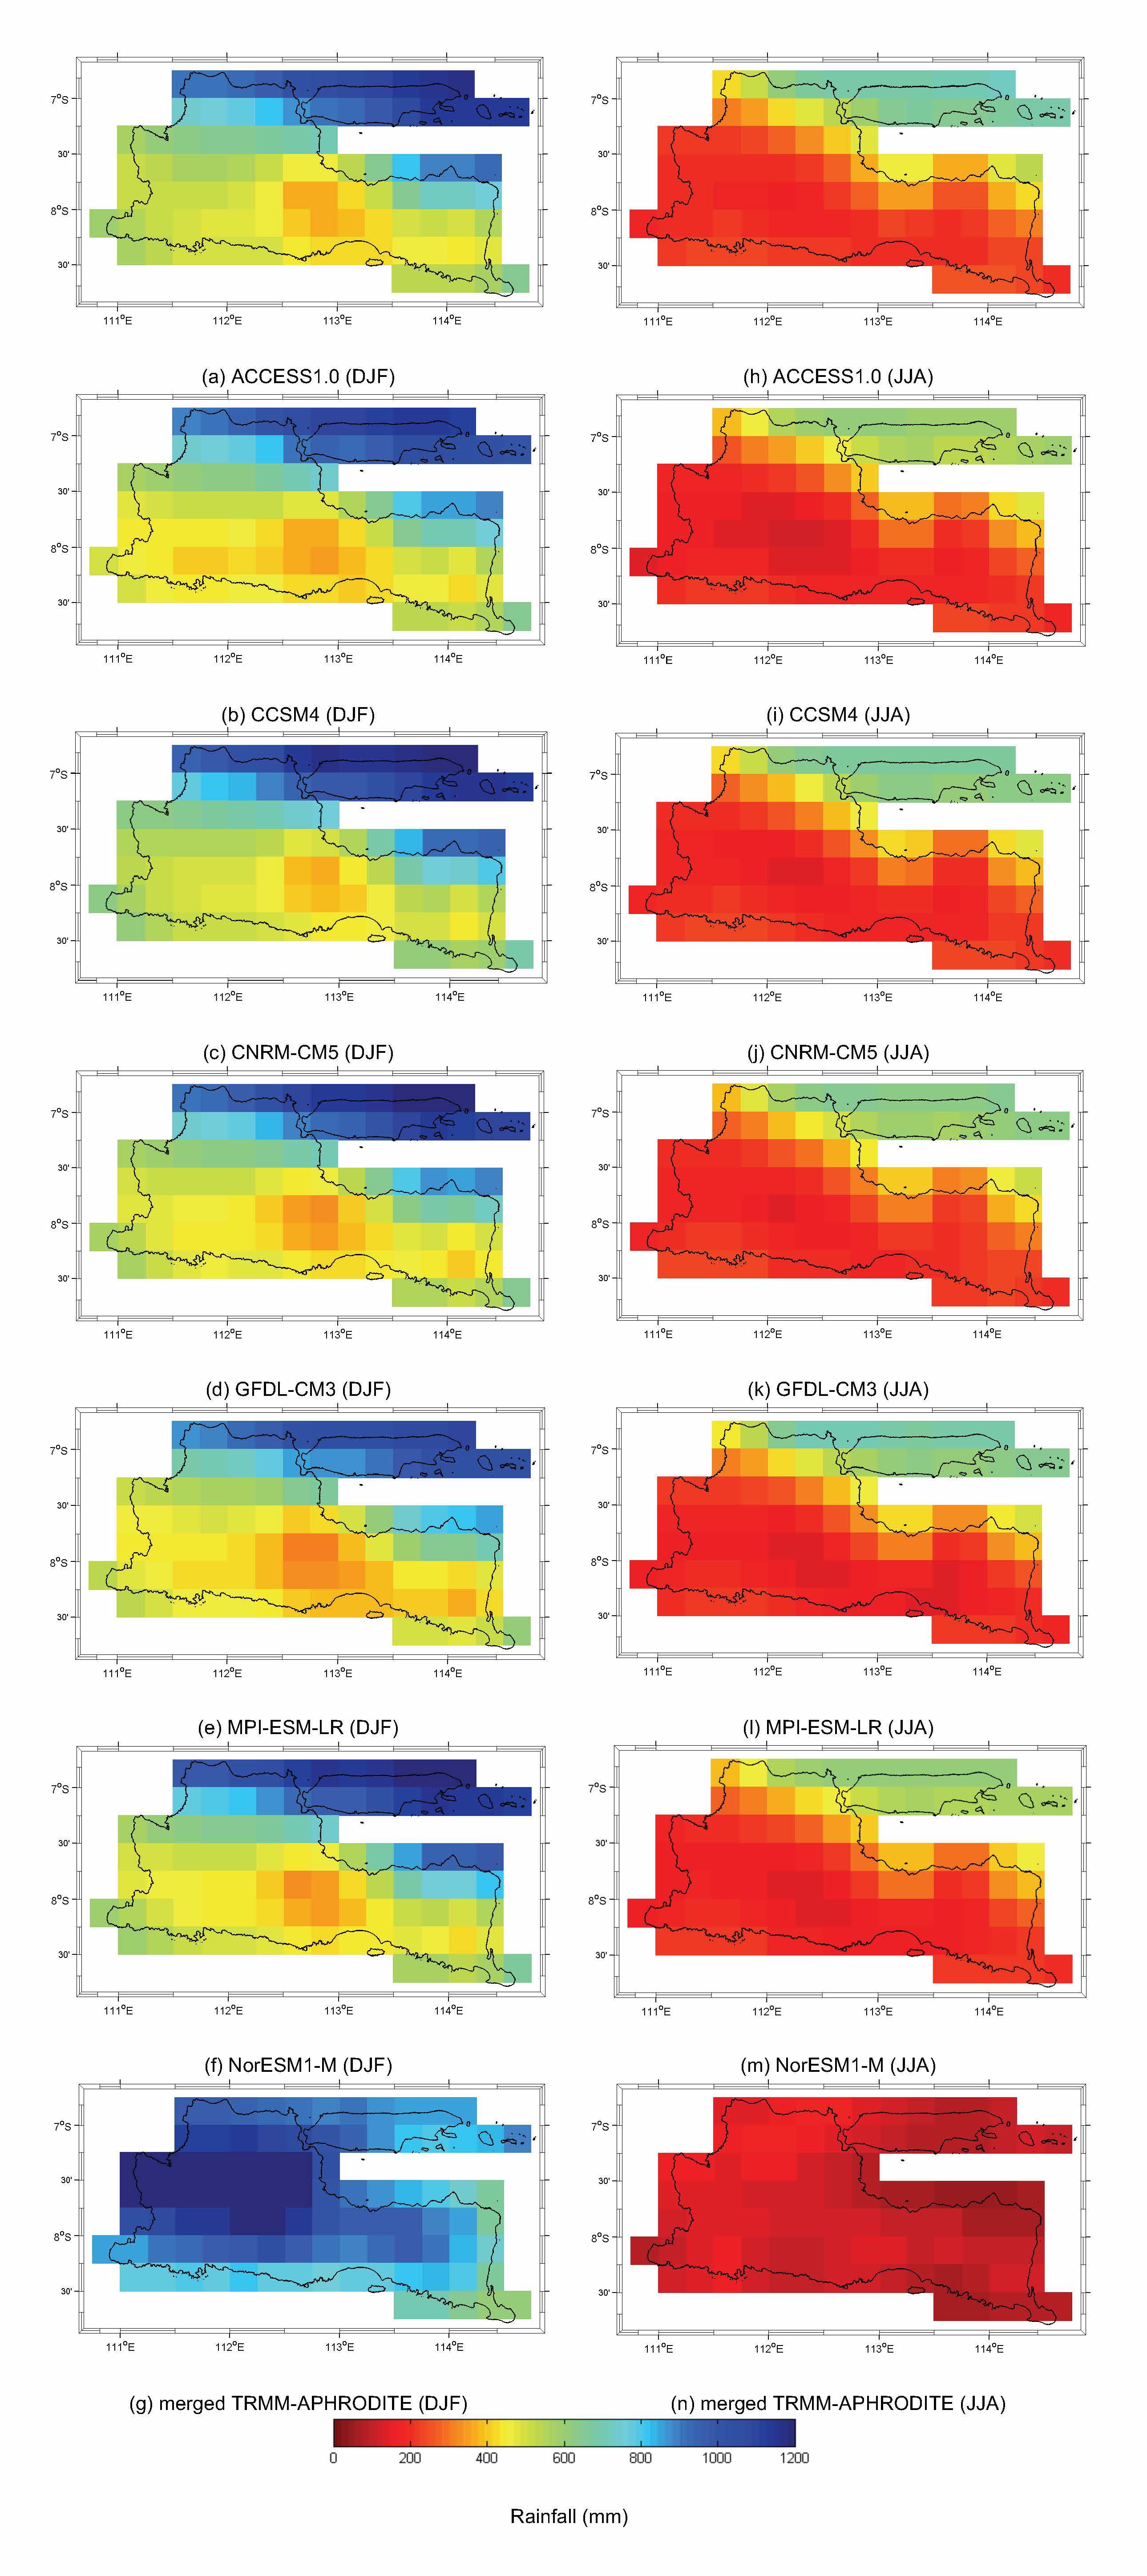
The second approach compared the spatial distribution of modelled mean rainfall in the December-January-February and June-July-August periods against those of the baseline data (TRMM-APHRODITE).
Observation data shows that central part of East Java is wetter than region around it, especially in December-January-February; however, the dynamically downscaled results show that northern part of East Java is wetter than the southern part in both December-January-February and June-July-August. The differences between dynamically downscaled results and observation data indicate an effect of local topographic processes that are not able to be resolved by the GCM’s resolution.